USBDM Functions in Eclipse (including Kinetis Design Studio)
The following sections assume that the required software has been installed Eclipse - Install (M68K, GNU tools)
After installing the USBDM plugin for Eclipse there will be a new menu item allowing convenient access to the USBDM functions.
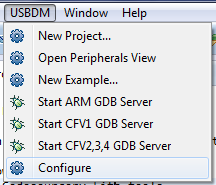
- New Project... - Create a new USBDM project for a Coldfire or ARM device
- Open Peripheral View - Open the USBDM Peripheral register view for use during debugging
- New Example... - Create a new USBDM example project
- Start ARM GDB Server - Launch the ARM GDB Server
- Start CFV1 GDB Server - Launch the Coldfire V1 GDB Server
- Start CFV2,3,4 GDB Server - Launch the Coldfire V2,3,4 GDB Server
- Configure - Configure USBDM options within Eclipse
Creating an Eclipse Cross-Compiler Project with USBDM
This section provides brief instructions on how to create a C or C++ project for a Coldfire or Kinetis target using Eclipse and either ARM Ltd or Codesourcery Lite tools.
The following example is for an Kinetis target but a similar process is followed for a Coldfire device.
- Select USBDM->New Project... from the Menu.
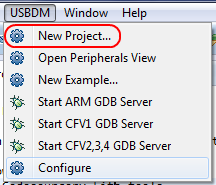
Create a new USBDM C/C++ Project
- Type in a Project Name
- Select the desired Coldfire or Kinetis target in C or C++ versions as preferred.
- Click Next
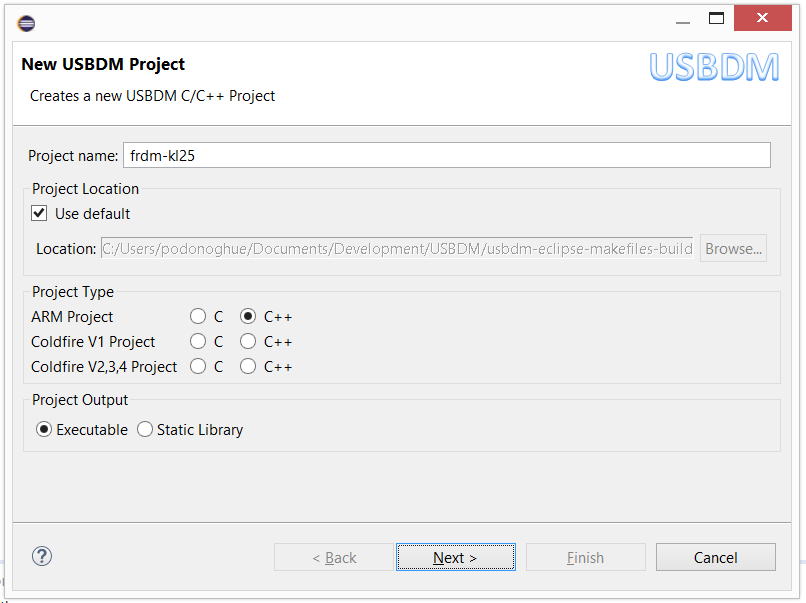
Select project parameters
- USBDM Parameters
- Select the Build Tools being used (choice only available for Kinetis devices)
- Select the device to be used.
- Select the Build Tools being used (choice only available for Kinetis devices)
- Click Next
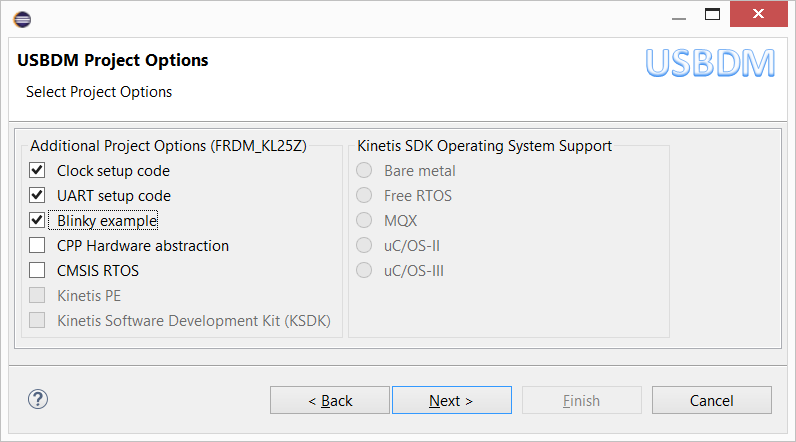
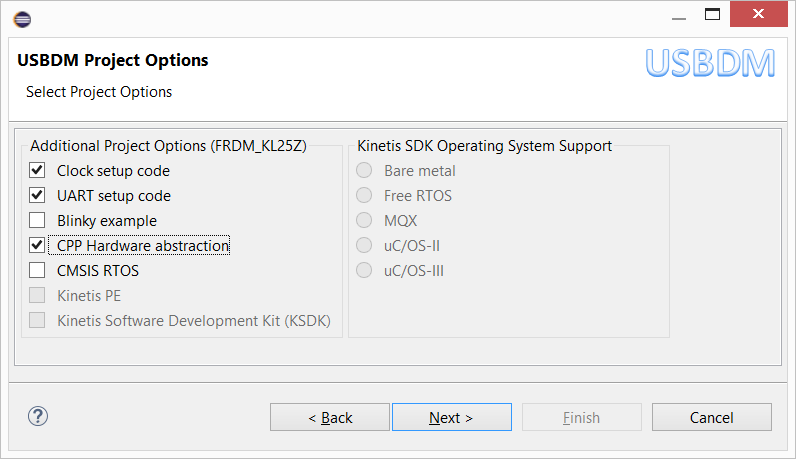
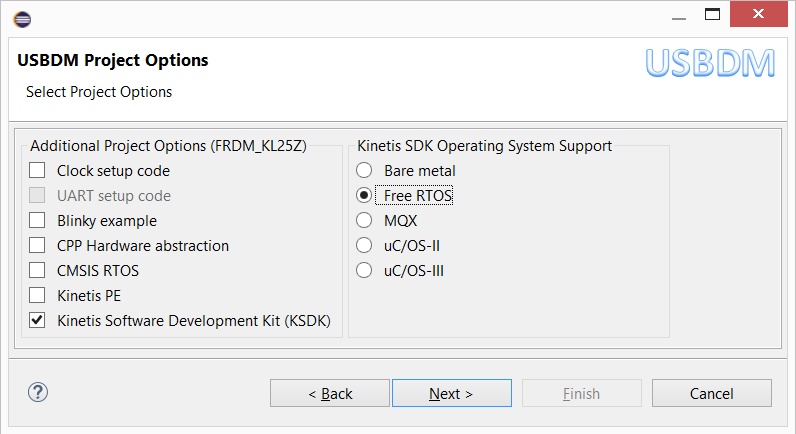
Select project options
- This page is specific to a particular device and the options will vary. The various options on this page interact so only certain combinations are allowed.
- Choose which optional components (files) to add to the project. Some of these will require manual customization upon completion of the Wizard. This is often the case for CMSIS on smaller devices where the heap and stack sizes as well as CMSIS options will need to be adjusted for the very limited amount of RAM available.
- Click Next
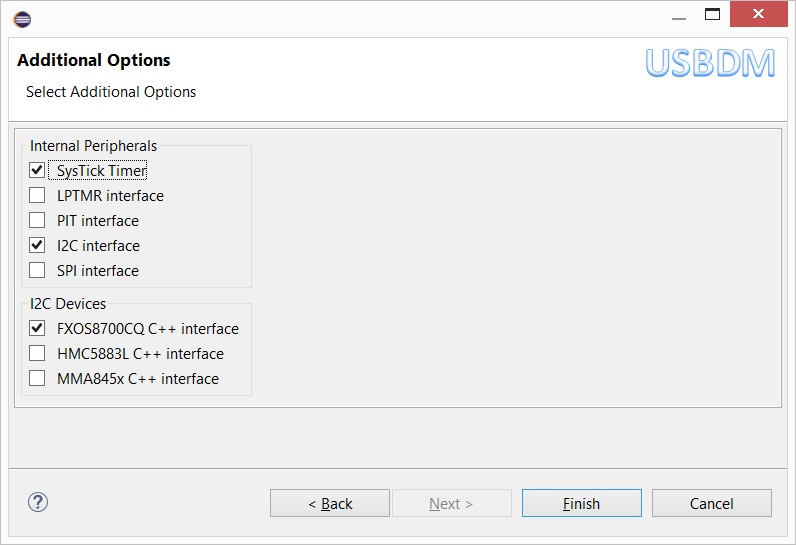
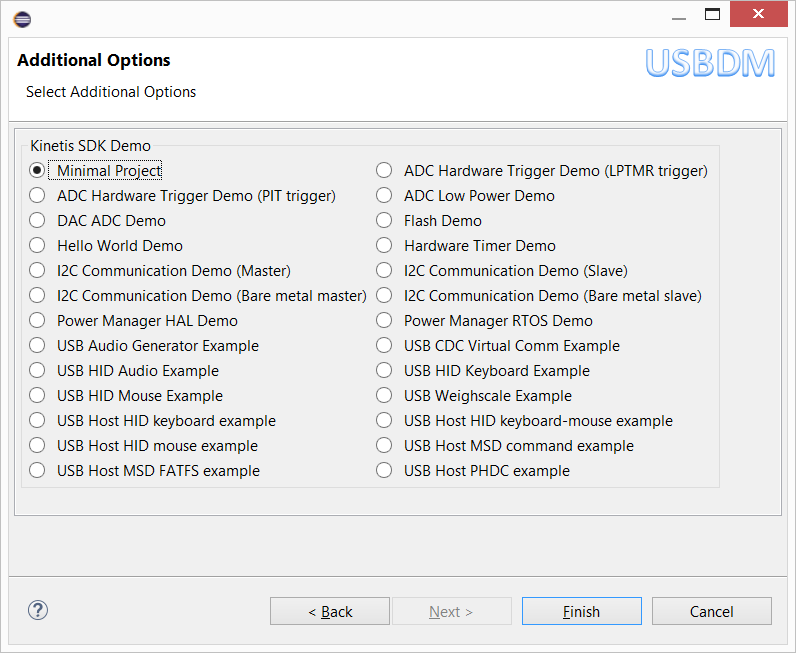
Select USBDM Additional Options
- This page selects different options that depend on the previous page.
Project Structure
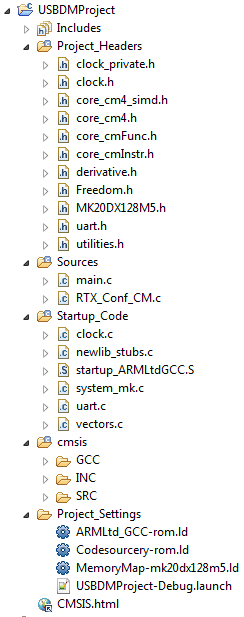
| The Wizard will create a basic project with a brief demonstration mainline. The project will contain optional components such as CMSIS-RTX if these option were selected. Expanding the project will display the project contents as shown:
|
It should now be possible to build the project using the menu item Project->Build All or by clicking on the hammer icon.
Customizing options in Eclipse using the Configuration Editor
Several of the project files (C source & header files and linker files) contain configuration information with mark-up in the comments section that allows convenient editing.
For example the MemoryMapxxx.ld file in the Project_Settings directory has settings for the HEAP and STACK size. These may be edited manually by changing the text of the file or alternatively the file may be opened in the Configuration Editor for a more convenient ways of doing this. Right-click on the file and choose Configuration Editor from the menu to do this.
The Configuration Editor provides two views of the file. One is a conventional text editor with simplified syntax highlighting of the mark-up describing the options (in red) and the embedded options in the body of the C code (in blue). The latter are just strings or numbers that may be modified within the GUI view provided by the editor.
The mark-up used is described here http://www.keil.com/support/man/docs/uv4/uv4_ut_configwizard.htm

| 
|
| There is extensive customization of the CMSIS-RTX configuration possible in the same way. Open the RTX_Conf_CM.c file located in the Sources folder using the Configuration Editor to change these settings. Refer to the CMSIS-RTX documentation provided by the CMSIS.html link within the project for details of what these various options do. | 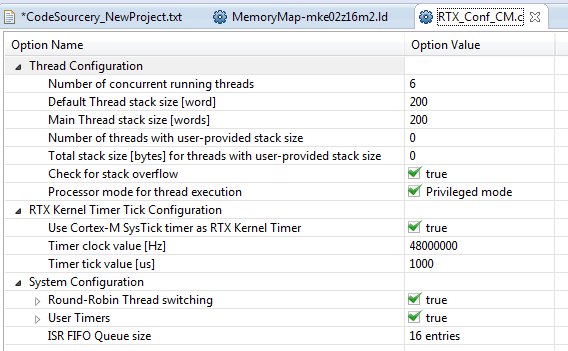
|
Launch Configuration Settings
The following describes important dialogues and settings in the launch configuration that will have been created by the USBDM Wizard.
- Select Run->Debug Configurations from the menu.
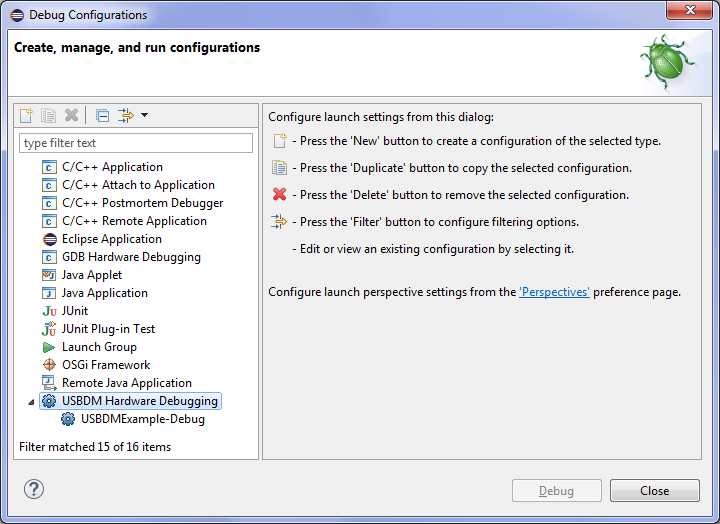
- Locate the launch configuration corresponding to the project just created. This will be under USBDM Hardware Debugging item in the left-hand panel.
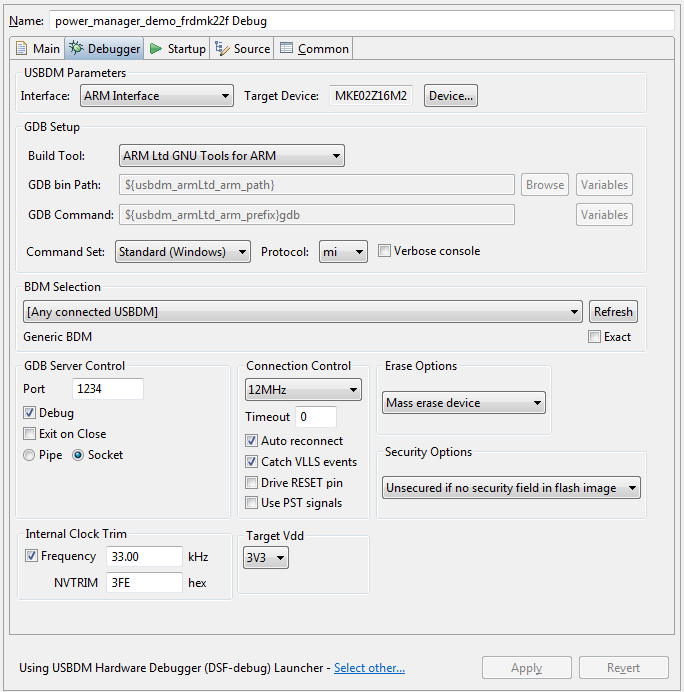
- Debugger Tab in the dialogue.
- USBDM Parameters
- Interface - This indicates the target-specific USBDM debugging interface being used.
- Target Device - Indicates the device being debugged.
- GDB Setup
- Build tool: - Selects the build tool being used. This controls the next two options. If a build tool is selected the next two options will be automatically set. Alternatively you may manually select a GDB debugger command.
- GDB Command: - The GDB command to be used.
- GDB Bin Path: - Where to look for the above command.
- Command Set - Standard
- Protocol Version - mi
- Verbose console mode - Selecting this will generate console messages indicating the GDB communication.
- Build tool: - Selects the build tool being used. This controls the next two options. If a build tool is selected the next two options will be automatically set. Alternatively you may manually select a GDB debugger command.
- BDM Selection
- Allows selection of a preferred or required BDM interface to use. A brief description of the BDM will appear below.
- Refresh - Updates the above selection dialogue with a list of the currently connected BDMs.
- Exact - Require use of the selected BDM. If not checked then the BDM selection is treated as a preferred BDM only.
- GDB Server Control
- Port number to use if Socket-based server is used (port will be localhost:portNumber).
- Debug - Use the debug version of the server. This will create a log of the server actions for debugging USBDM.
- Exit on Close - Causes the Socket server to close when the debug session ends. Otherwise the the server can be re-used which will reduce the startup time. This is only possible when using the same device & settings.
- Pipe/Socket - choose Pipe-based or Socket-based server. The Socket based server is preferred. This will open as a separate window showing the interaction with the BDM.
- Connection Control (Contents vary with target)
- Interface speed - speed for bdm communication
- Timeout - How long to wait for a unresponsive target. Set this to zero if you are using VLLS or LLS power modes as they result in the bdm loosing connection with the target
- Auto reconnect - BDM will continuous resync with target - leave selected
- Drive RESET pin - Usually leave unselected
- Catch VLLSx events - This will cause the debugger to suspend on the reset that wakes the target up after VLLS mode.
- Use PST signal - Some CFVx devices have PST signals that allow more reliable monitoring of target run state.
- Erase Options
- Erase options - USBDM supports several erase methods. MASS erase is preferred for ARM & Coldfire V1. ALL is preferred for Coldfire Vx.
- Security Options
- This controls how the security field in the target FLash is programmed.
- Security field from flash image - The flash will be programmed unchanged from the image. If the image does not contain security information then the target may end up secured and be impossible to debug.
- Default unsecured configuration - A default value which results in the target being unsecured will be used.
- Unsecured if no security field in flash image - If the flash contains security information then that will be used otherwise the default unsecured value is used.
- This controls how the security field in the target FLash is programmed.
- Target Vdd
- Some versions of BDM support suppling power to the target through the BDM cable. This selects the voltage level if controllable.
- Internal Clock Trim
- Allows trimming of internal clock if supported. See programmer manual for more detail.
- USBDM Parameters
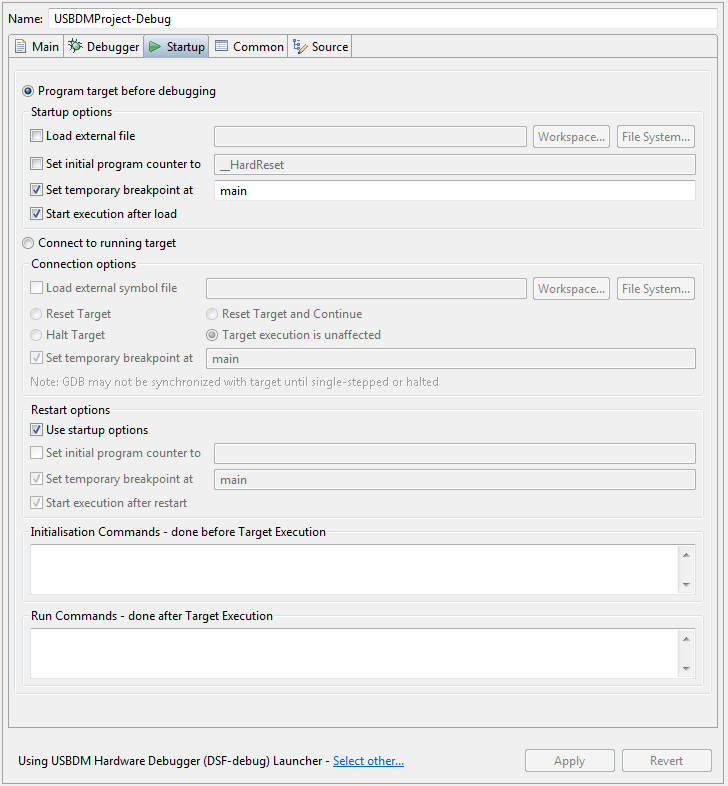
- Startup Tab in the dialogue.
- Program target before debugging - This option enables programming the target at the start of a debugging session.
- Startup options
- Load external file - If selected these options may be used to select a external file to load code and symbols from.
- Set initial program counter to - If selected the program counter is set after loading. This is useful if debugging a RAM image where the reset vector will usually be invalid.
- Set temporary breakpoint at - If selected this option sets a temporary breakpoint at the given address. This is usually used in conjunction with Start execution after load.
- Start execution after load - The execution is commenced after loading.
- Connect to running target - This option allows debugging a target without re-programming the flash.
- Connection options
- Load external symbol file - If selected these options may be used to select a external file to load symbols from.
- Reset Target - The target is reset after connection
- Reset Target and Continue - The target is reset and then execution resumed
- Halt Target - The target is halted
- Target execution is unaffected - The target remains in a halted or executing state.
- Set temporary breakpoint at - If selected this option sets a temporary breakpoint at the given address. This is usually used in conjunction with Reset Target and Continue.
- Restart options - These options apply when using the restart button during a debugging session.
- Use startup options - If selected the the same options are used for restart and for the initial program load.
- Set initial program counter to - If selected the program counter is set after loading. This is useful if debugging a RAM image where the reset vector will usually be invalid.
- Set temporary breakpoint at - If selected this option sets a temporary breakpoint at the given address. This is usually used in conjunction with Start execution after restart.
- Start execution after restart - The execution is commenced after loading.
- Initialisation Commands - done before target Execution - This may be used to run custom GDB commands
- Run Commands - done after Target Execution - This may be used to run custom GDB commands
Debugging
You can now start a debugging session using the launch configuration above.
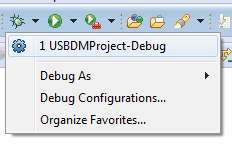
- With the default launch settings you should find that the follow steps occurring:
- Session starts
- The program is down-loaded to the target
- Execution commences at the program reset location
- Execution stops at the first line of main()
- When using the Restart button during a session the following sub-sequence will occur:

- The target is reset
- Execution commences at the program reset location
- Execution stops at the first line of main()
You should be able to debug in the usual fashion with breakpoints, single-stepping etc.
- With the default launch settings you should find that the follow steps occurring:
Running
- You may also use the same launch configuration to start a run session. Its main use is to do a quick check on programming the target and checking program execution.
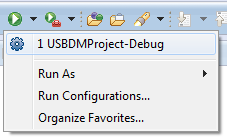
- This differs from the Debugging session by doing the following sequence without any interaction:
- Session starts
- The program is down-loaded to the target
- Execution commences at the program reset location
- The session ends.
- This differs from the Debugging session by doing the following sequence without any interaction:
Debug Peripheral View (ARM Targets only)
- The peripheral view provides a register level view of the peripherals in the target when debugging.
This view may be opened from the USBDM menu. Please be aware that the view has to read the register values from the target. This has two obvious effects:- Reading some peripheral registers may affect the peripheral's state. The view uses the debug interface to access the peripheral's registers. This is not the same as the processor accessing the peripheral and in many cases does NOT affect the state as would be naively expected. Please refer to the detailed peripheral description to check for any side-effects of debug accesses.
- The peripherals may contain many registers and may require individual accesses to many distinct locations. This can be rather slow so having many registers visible may impact on stepping speed. The view intelligently merges accesses to adjacent memory locations where possible. This improves the performance but there are still a few situations where this cannot be done e.g. the USB devices appear as many disjoint byte locations so may require individual accesses for each register. Not much can be done to improve the speed since this basically requires pushing many messages through GDB which is a bottleneck.
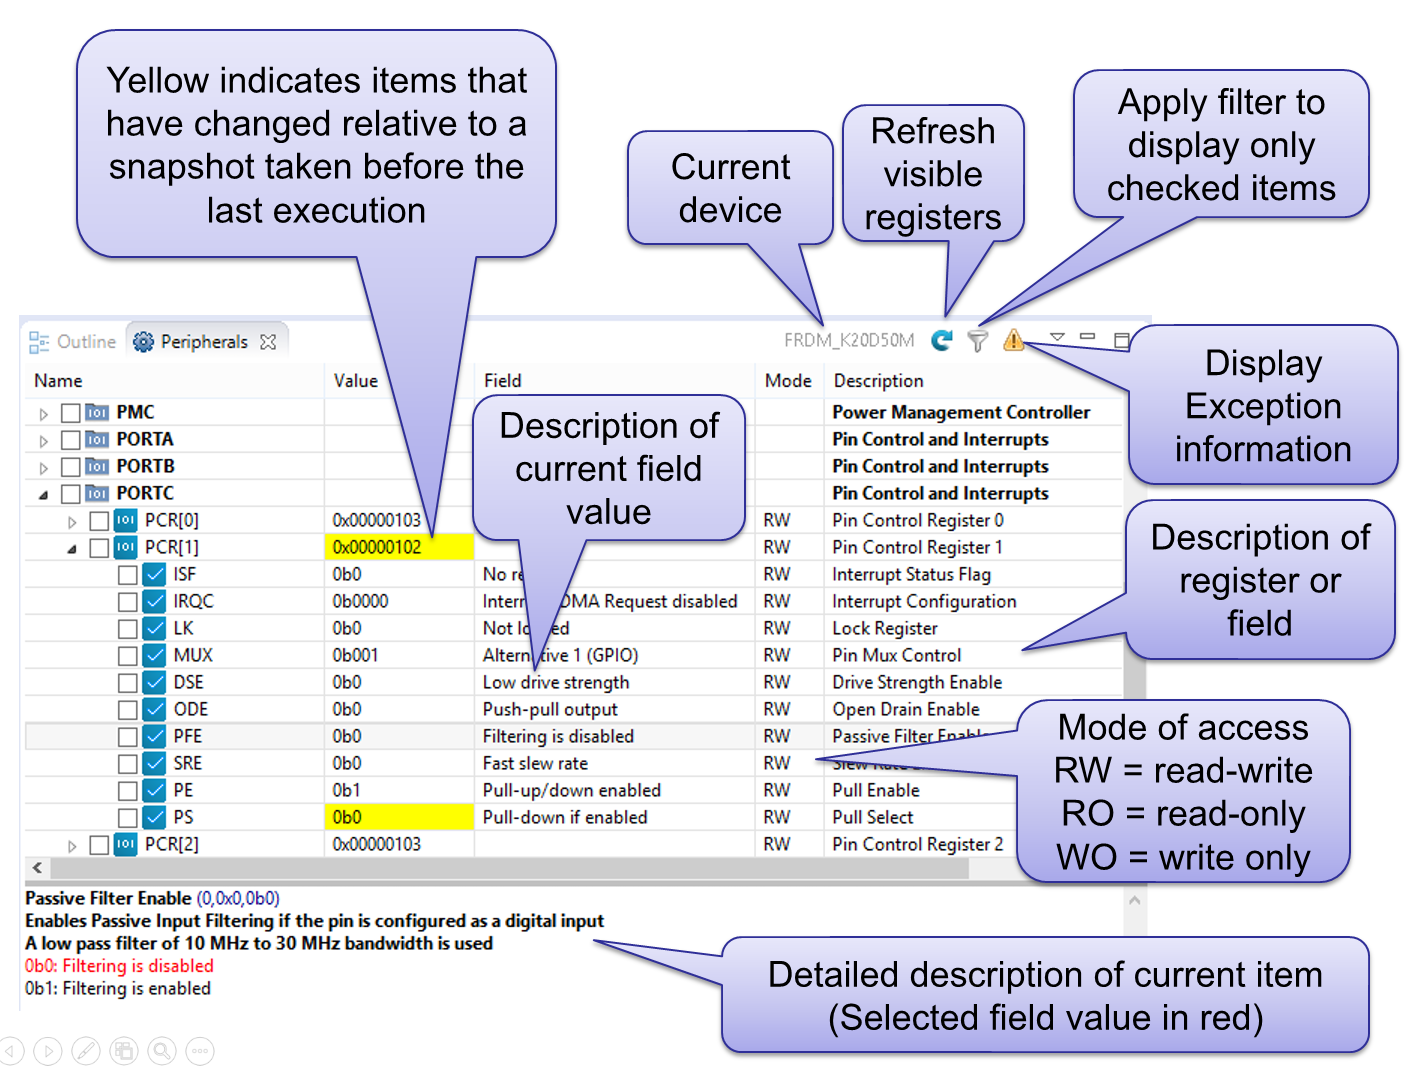
- The peripheral view supports modifying registers interactively but this feature should be used carefully.
When a register or field is changed the updated value is written to the target and then the register (and often adjacent registers) are re-read to obtain updated display values as they may not be consistent with the value actually written. For example, writing to the GPIOA_PSOR has no affect on the GPIOA_PSOR value which always reads as zero. It will however change the values of the GPIOA_PDOR register and probably the GPIOA_PDIR register. This will be reflected in the view since these register are all re-read.
Fault Status Dialogue (ARM Targets only)
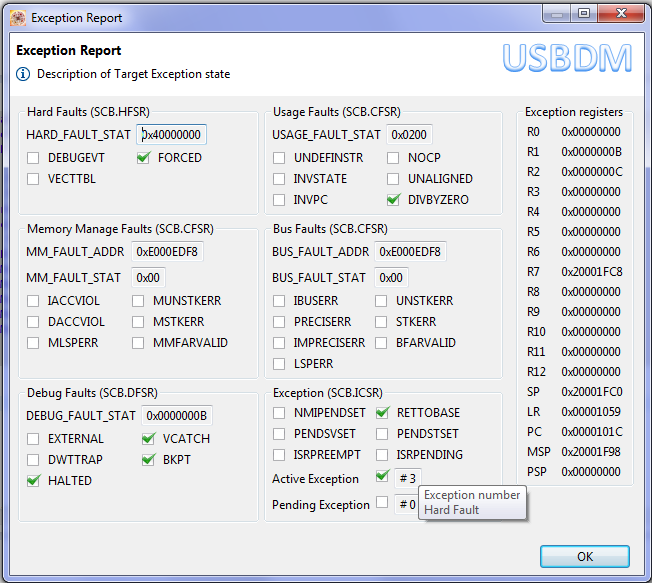
- The Fault Status dialogue provides a convenient summary of the fault status of a target being debugged. Its main use would be after the unexpected execution of a fault handler.
This dialogue is opened from the icon bar of the peripheral view. The same information is available in the appropriate SCB registers (CFSR, HFSR, DFSR, MMFAR, BFAR) although not in as convenient a form
- A couple of useful references relating to handling faults are:
